
Real gas mileage is miles driven divided by gallons added between two fill-ups to the first click of the pump. Not the number on the dash — in-dash displays read up to 6% optimistic — and not the EPA sticker, which describes an average driver in a lab, not you. Do it over three or four tanks and divide total miles by total gallons; one tank can be 5% off just from where the nozzle stopped. A car that lands within 10–15% of its combined EPA figure is a healthy car and a normal driver.

Three different numbers claim to be your car’s gas mileage, and only one of them is. The window sticker says 32. The trip computer says 30.8. The fuel gauge and the credit card statement suggest something else entirely. This article is about the third number — the one that costs you money — and the only method that measures it honestly: two full tanks, an odometer and a pump receipt. We cover the formula and a worked example, the seven ways the figure goes wrong, how to convert between mpg, L/100 km and km/L when a review or a friend abroad uses a different unit, how far from the sticker is normal, and what the number is telling you when it starts to drift.
Three numbers that are not your gas mileage#
The EPA sticker. The combined figure on the window label comes from a dynamometer test — a car on rollers, following a speed trace — and is then adjusted by a formula meant to represent the average American driver: some cold starts, some air conditioning, some high speed. It is a fair comparison tool between cars. It is not a prediction for your commute, your climate or your right foot.
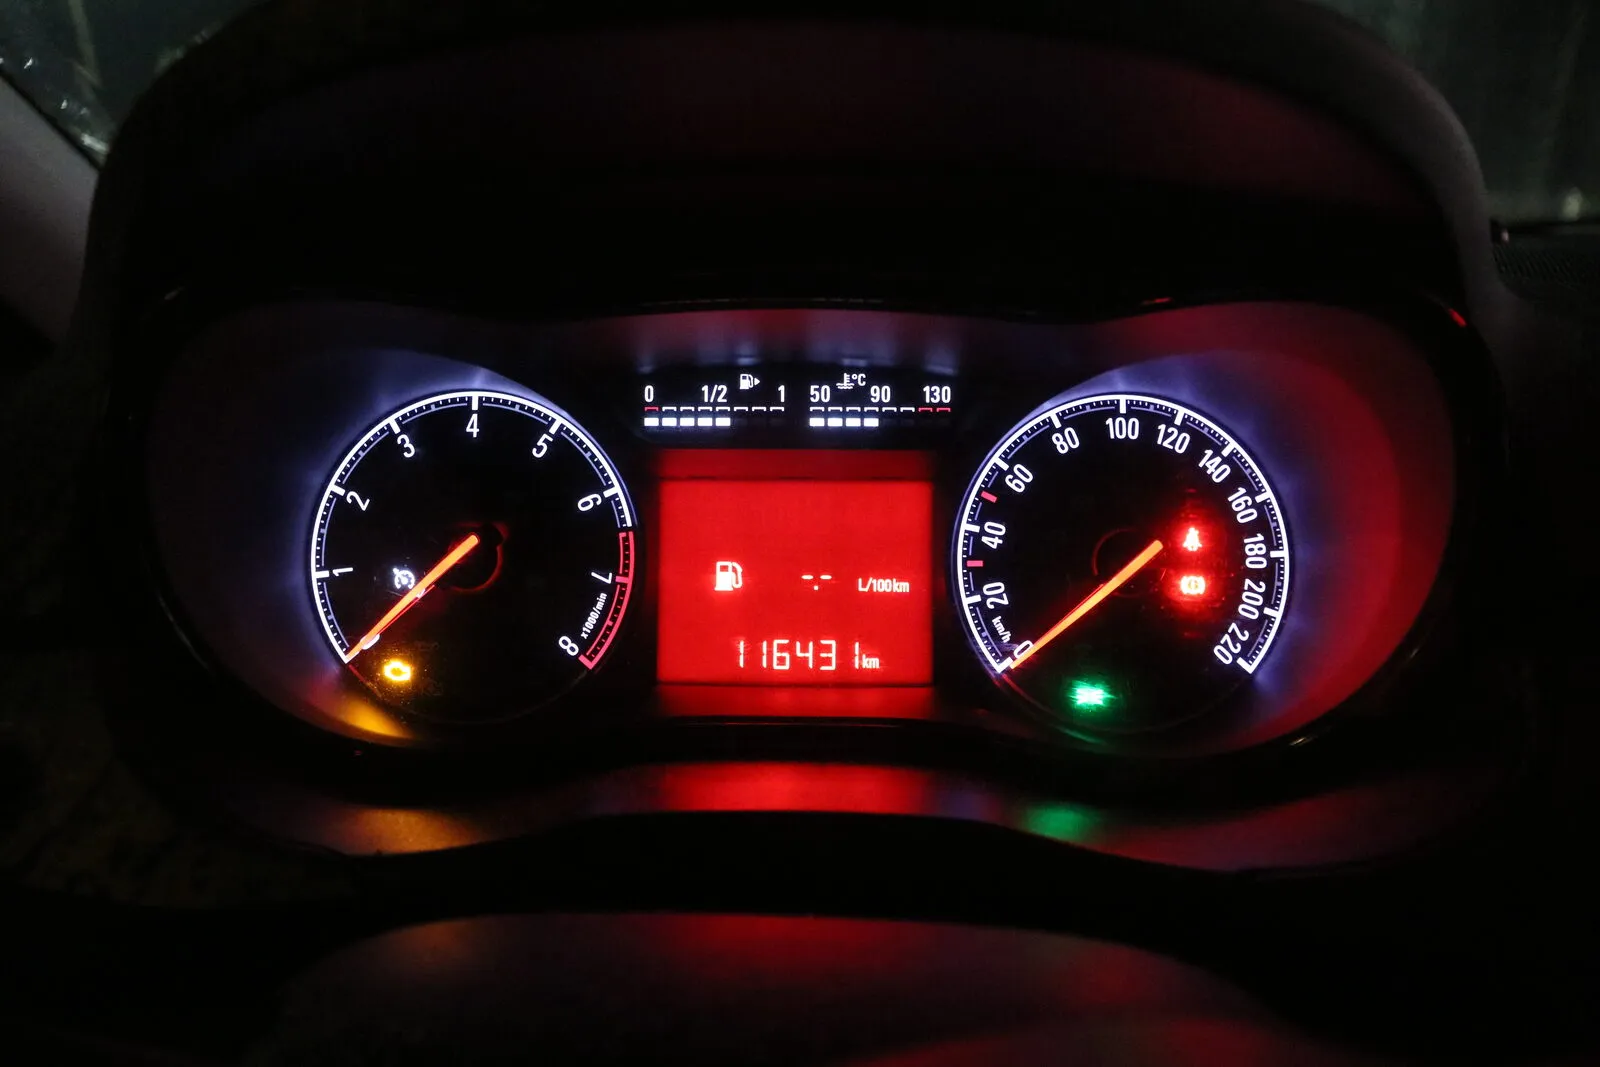
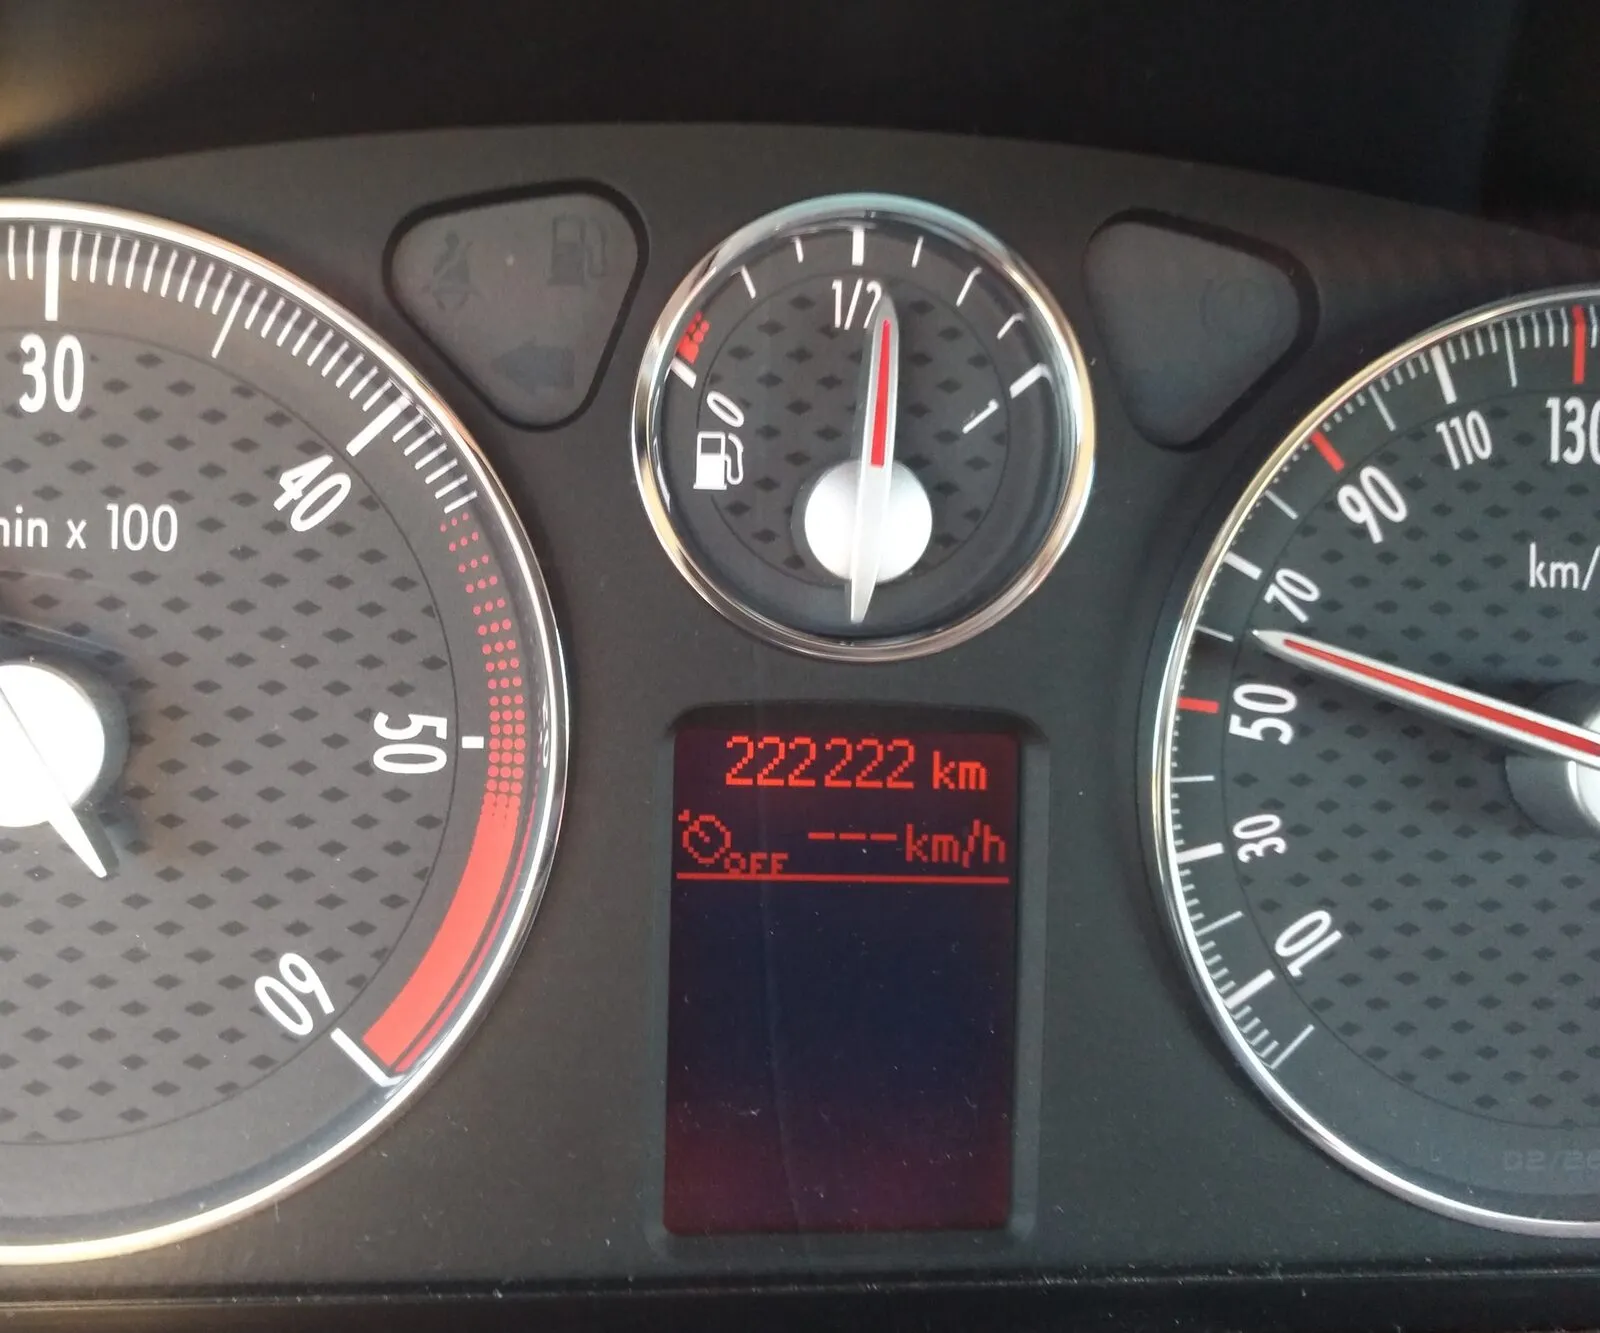
The trip computer. The car does not measure fuel; it counts injector pulses and estimates. In AAA’s 2021 test of in-dash fuel-economy displays the average error was 2.3%, but one vehicle read 6.4% higher than the fuel it actually burned and only one read low at all; an earlier Edmunds test averaged about 5% optimistic with a hybrid 19% high. The display also resets whenever someone presses the button, so its “average” often covers one tank or one trip. Useful for watching your driving in real time; useless as the number you plan a budget on.
The range-to-empty. A projection of the same estimate over the fuel the gauge thinks is left, with a safety margin built in: in the AAA test every car still had 6 to 55 miles of real range at indicated zero. Good for deciding whether to stop at this exit or the next one, meaningless for measuring consumption.
The only thing that measures how much fuel your car uses is the pump. It is calibrated, inspected by the state, and prints the volume to a thousandth of a gallon on a receipt you already have. Everything below is about using that number properly.
The full-tank method, step by step#
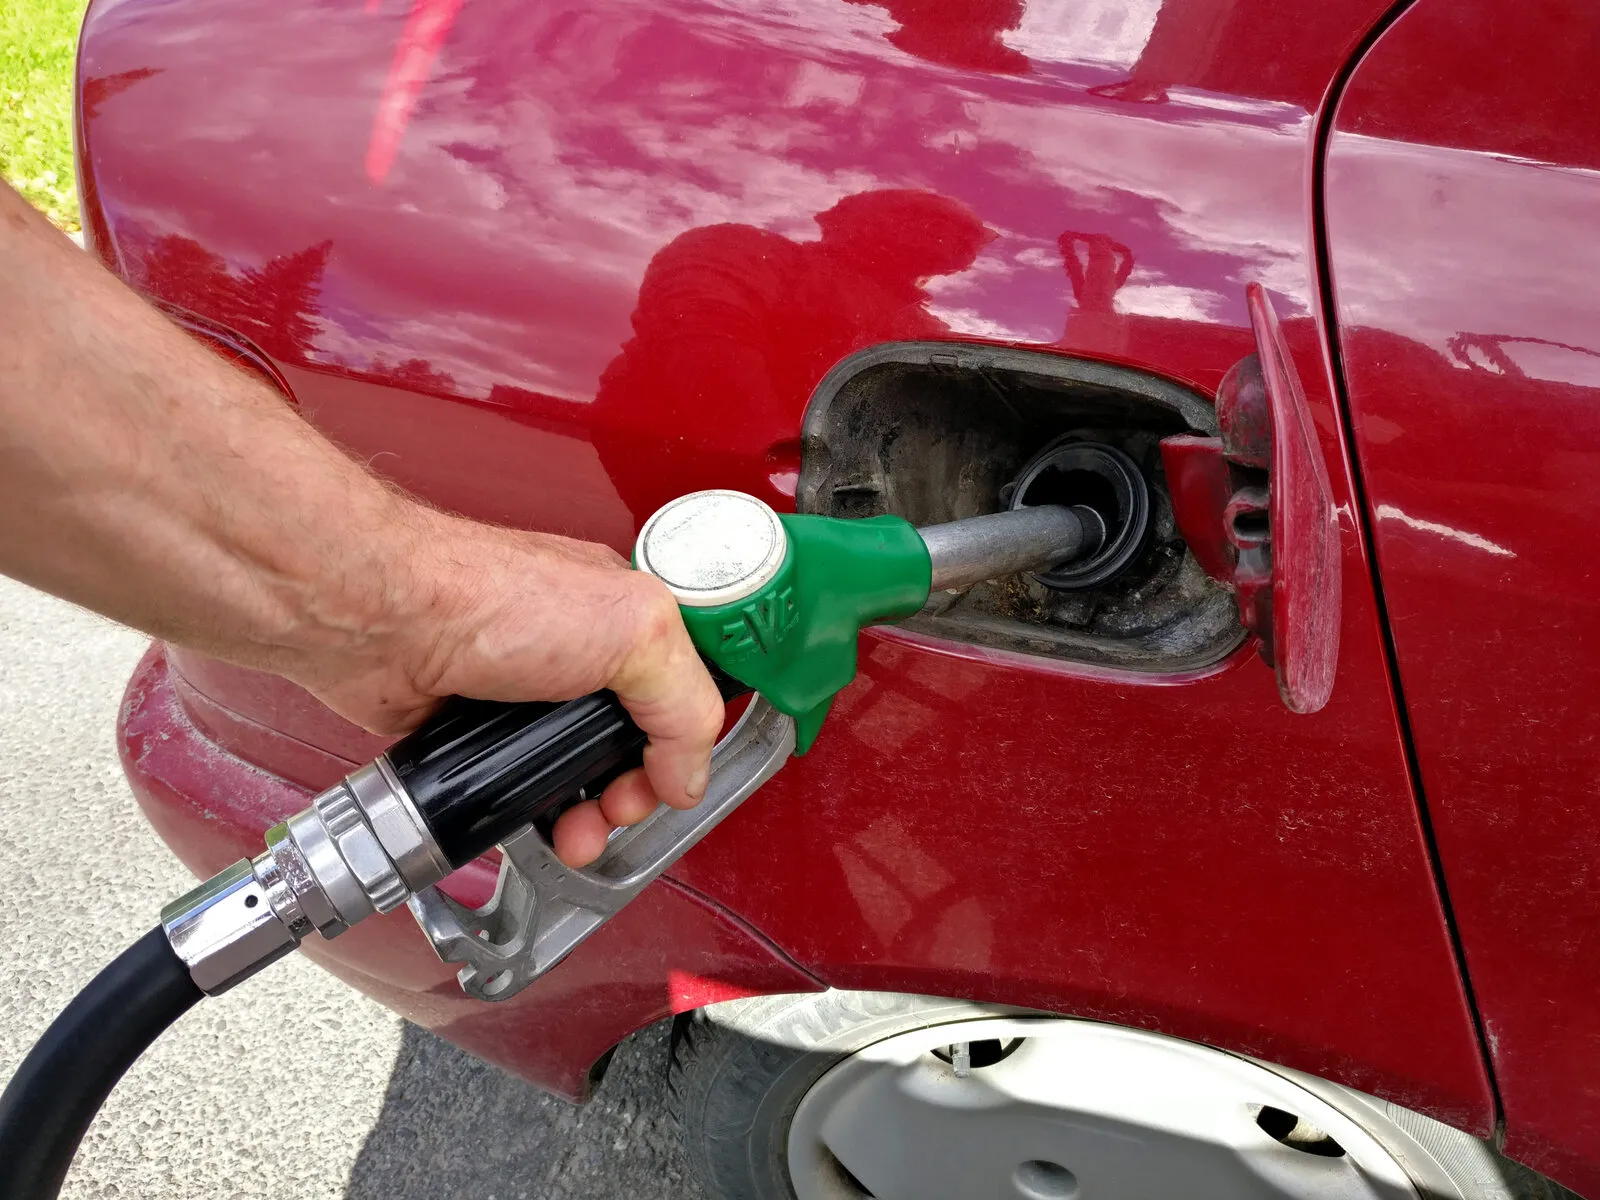
- Fill up to the first click. Let the nozzle shut off on its own and hang it up. Do not squeeze in another half gallon.
- Write down the odometer — the main one, not a trip meter. A photo of the dash or a line in an app is fine. This is your starting point; the gallons of this first fill-up do not matter.
- Drive normally for at least half a tank. Do not change how you drive for the experiment; the point is to measure what you actually do.
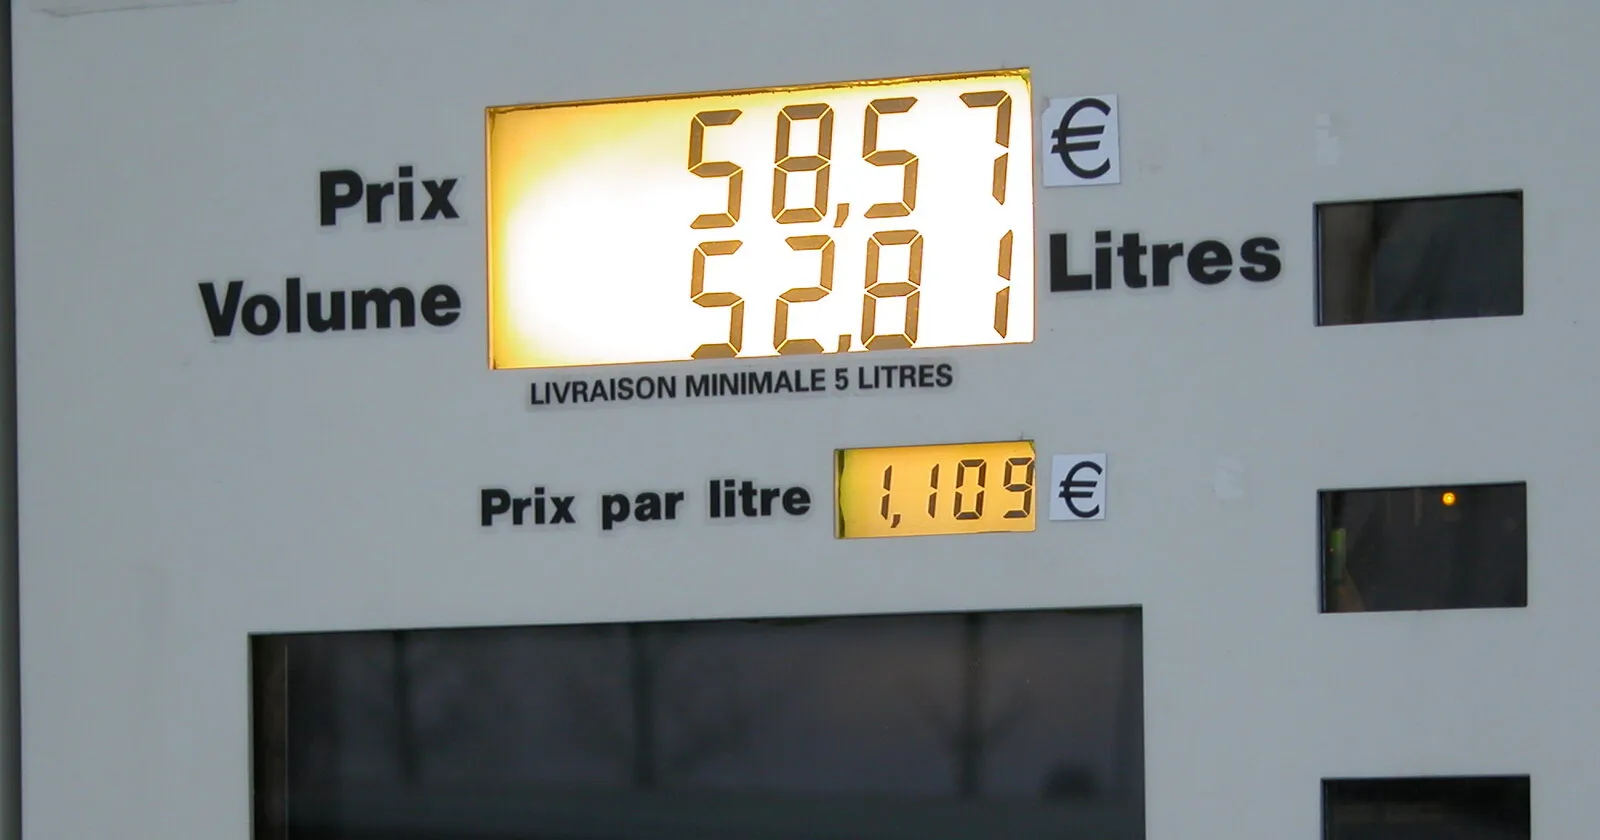
- Fill up again to the first click, at the same pace of pumping, ideally at a pump of the same type. Note the gallons from the receipt (three decimals) and the odometer.
- Divide miles by gallons. Odometer now minus odometer then, divided by the gallons of the second fill-up. That is the gas mileage for the interval.
- Repeat, and keep a running total. After three or four fill-ups, divide the total miles by the total gallons. That figure is your real gas mileage; the per-tank numbers are noise around it.

Calculate your MPG now#
Type the miles between two full tanks and the gallons the second one took. The calculator returns the figure in miles per gallon and in the three units the rest of the world uses, plus what the fuel costs you per 100 miles at the price you paid.
Your real gas mileage
- Miles per gallon (US)
- 30.5 mpg
- L/100 km
- 7.7 L/100 km
- Miles per imperial gallon
- 36.6 mpg
- km/L
- 13.0 km/L
- Fuel cost per 100 miles
- $14.16
Enter the miles you drove between two full tanks and the gallons the second fill-up took. The pump receipt has the gallons to three decimals; the odometer has the miles. Nothing is stored.
A worked example: why one tank is never enough#
Here is a real-shaped log for a mid-size sedan rated 30 mpg combined. Every fill-up went to the first click at pumps of the same brand; the third one was topped off by a helpful passenger. Watch the two right-hand columns.
| Fill-up | Odometer | Miles | Gallons | This tank | Running |
|---|---|---|---|---|---|
| 1 (baseline) | 41,208 | — | 12.6 | — | — |
| 2 | 41,571 | 363 | 11.9 | 30.5 mpg | 30.5 mpg |
| 3 (topped off) | 41,902 | 331 | 12.4 | 26.7 mpg | 28.6 mpg |
| 4 | 42,244 | 342 | 10.6 | 32.3 mpg | 29.7 mpg |
| 5 | 42,590 | 346 | 11.6 | 29.8 mpg | 29.7 mpg |
Running figure = total miles since fill-up 1 ÷ total gallons of fill-ups 2–5 (1,382 mi ÷ 46.5 gal). The gallons of the baseline fill-up never enter the calculation.
The per-tank column swings from 26.7 to 32.3 — a 20% spread on a car that did not change. The extra fuel squeezed in at fill-up 3 made that interval look thirsty and the next one look frugal; a week of short winter trips or one long highway run does the same. The running column, meanwhile, settles at 29.7 after four intervals and barely moves after that. This is the whole argument for a log instead of a one-off test: the per-tank figure tells you about the tank, the running figure tells you about the car.
The arithmetic behind the swing is worth seeing once. A 12-gallon fill can easily differ by half a gallon depending on the pump, the nozzle angle and the moment the float valve trips. Over 350 miles, 11.5 gallons is 30.4 mpg and 12.5 gallons is 28.0 mpg — an 8% spread from the same car and the same driving, before anything real has happened. Spread the same half gallon over 1,400 miles and 46 gallons and it becomes a 1% ripple.

Seven mistakes that skew the figure#
1. Counting a partial fill-up as an interval
Twenty dollars’ worth at a station you were passing is fine — but that fill-up cannot end an interval, because you do not know how much fuel is in the tank. Log it, mark it partial, and let the interval run to the next fill-up to the click: the miles from both legs divided by the gallons from both fill-ups. Brimly does this automatically; the fuel consumption is only ever computed between two full tanks, and a partial fill-up simply extends the interval.
2. Topping off after the click
The half gallon you squeeze in after the nozzle stops is the single biggest source of per-tank noise, as the example above showed — and it also floods the charcoal canister of the vapour-recovery system, which is a real cause of the P0455 family of check-engine codes. The method does not require a truly full tank; it requires the same level each time, and the first click is the only repeatable one.
3. Changing pump, nozzle speed or the slope you park on
Nozzles trip at different levels: a fast high-flow pump shuts off earlier than a slow one, and a car parked nose-up holds more fuel before the neck fills. Hold the trigger at the same notch every time and, when you can, use the same station. This is also why a single road-trip tank filled at unfamiliar pumps in three states tells you little.
4. Trusting a trip meter you forgot to reset
Trip A is a fine convenience until the one time it wasn’t reset at the pump — and you cannot tell afterwards. The odometer cannot be forgotten. Write down the total mileage at each fill-up and subtract; it costs ten seconds and removes a whole class of errors. The odometer also tends to read about 1–3% high because of tire size and wear, which is a small fixed bias, not noise — it flatters your mpg slightly and evenly.
5. Judging the car on a single tank
“I got 34 on the way to the lake” is a fact about the lake trip. It contains one nozzle click, one weather, one road. Wait for three or four intervals before drawing a conclusion, and never compare one tank to the sticker. A running figure across 1,000 miles is the smallest thing that deserves to be called the car’s gas mileage.
6. Leaving a fill-up out of the log
If someone else filled the car, or you forgot, the next interval is silently wrong: the miles are there, the gallons are not, and the car looks spectacular. Mark the gap — “a fill-up is missing before this one” — and exclude that interval from the average. A log that does this honestly is worth more than a longer one that doesn’t.
7. Mixing gallons, litres and the sticker figure
A British review quotes 45 mpg on the imperial gallon, which is 20% bigger than the US one; 45 UK mpg is 37.5 US mpg. Canadian pumps sell litres; a European friend quotes 7.5 litres per 100 km, a Japanese one 15 km per litre. And the sticker, as discussed, is a lab figure adjusted for an average driver. The conversions are one division each — see the table below — but every one of them has caught someone convinced their car was broken.
Converting between mpg, L/100 km and km/L#
Miles per gallon counts distance per fuel, so a bigger number is better. Litres per 100 km counts fuel per distance, so a bigger number is worse — which is why the two are related by a division, not a multiplication, and why a 10% improvement is not the same size in both units. The constants: L/100 km = 235.2 ÷ US mpg; L/100 km = 282.5 ÷ UK mpg; km/L = 100 ÷ L/100 km; UK mpg = US mpg × 1.2.
| US mpg | UK mpg | L/100 km | km/L | Gal per 100 mi |
|---|---|---|---|---|
| 20 | 24.0 | 11.8 | 8.5 | 5.0 |
| 25 | 30.0 | 9.4 | 10.6 | 4.0 |
| 30 | 36.0 | 7.8 | 12.8 | 3.3 |
| 35 | 42.0 | 6.7 | 14.9 | 2.9 |
| 40 | 48.0 | 5.9 | 17.0 | 2.5 |
| 50 | 60.0 | 4.7 | 21.3 | 2.0 |
US gallon = 3.785 L, imperial gallon = 4.546 L. The EPA prints “gallons per 100 miles” on the sticker precisely because it adds up the way cost does: going from 20 to 25 mpg saves one gallon per 100 miles; going from 40 to 50 saves half a gallon.
How far from the sticker is normal?#
Less far than in Europe, but not zero. Since 2008 the EPA has adjusted label values downward to reflect real driving, and when Consumer Reports compared its own road tests with the labels it found the average difference was under 1 mpg — about 3%. Two categories miss by more: hybrids, which CR measured about 9% below their labels, and small turbocharged engines, three quarters of which fell short in a 2013 study, some by 15%, because the test cycle rarely puts the turbo under boost and your on-ramp always does.
For comparison, the European Commission’s first report from the fuel-consumption meters now fitted to every new car found real-world petrol consumption 21% above the WLTP lab figure and diesel 17% above; plug-in hybrids used three to four times the fuel their labels promised. That is why a European owner treats a 15–30% gap as normal — and why Brimly, which shows the manufacturer’s figure behind your own trend, shades that range as a corridor rather than colouring it as a fault.
On a US label, then: within 10% of the combined figure is a healthy car and a normal driver. 10–20% is worth a look at the driving pattern — mostly short trips? a lot of 75 mph? — before anything mechanical. 25% or more, sustained over several tanks and not explained by winter, is a car telling you something, and the last section is about how to listen.
.jpg)
Hybrids, plug-ins and EVs: what changes#
A regular hybrid is measured exactly like any gasoline car — the battery is charged only by the engine, so every mile still comes out of the tank. Expect a bigger gap to the sticker in winter, when the engine runs to heat the cabin, and a smaller one in stop-and-go traffic where the hybrid earns its keep.
A plug-in hybrid needs two logs, because two energy sources feed the same miles: gallons at the pump and kilowatt-hours at the charger. Divide the miles by each separately and keep both — a PHEV driven on gasoline alone rarely beats the equivalent regular hybrid, and the honest figure for “what it costs me per mile” has to add the electricity. Any single mpg number for a plug-in is a statement about how often it was charged, not about the car.
An electric car uses the same method with kWh instead of gallons: energy delivered by the charger (not the car’s own estimate, for the same reason as the trip computer) divided by miles gives kWh per 100 miles, which is how the EPA label states it. Charging losses of 10–15% between the wall and the battery are real fuel you paid for; measure at the wall. Brimly treats kWh as a fuel unit for exactly this reason, so an EV or a plug-in logs its charges next to its miles like any fill-up.
Turning the figure into money#
Gas mileage is an odd unit to budget in; cost per 100 miles is not — and fuel is only one of the six lines in what a mile of ownership really costs. At the national average of about $4.32 a gallon in mid-September 2026, the 30 mpg sedan above costs $14.40 per 100 miles and a 20 mpg SUV $21.60 — a $7 difference every 100 miles, or about $900 a year at 12,000 miles. That is also the clean way to compare two used cars you are considering, or to check whether premium fuel is worth the extra 60 cents on a car that doesn’t require it: the mpg gain would need to be about 14% just to break even, and it never is.
For a trip, the same figure times the distance is the fuel budget. Our trip fuel-cost calculator routes the drive and does the multiplication with your own mpg; put in the real figure from the log rather than the sticker and the number you arrive with matches the receipts.
When the number drifts: what it’s telling you#
A log kept for a year has a second use beyond bragging rights: the running figure becomes a baseline, and a departure from it is information. Roughly in order of likelihood:
- Season. A 10–15% winter penalty is physics, not a fault — cold oil, dense air, a richer warm-up mixture and winter-blend fuel. Compare December to last December.
- Driving pattern. A new job with a five-mile commute can cost 20% on its own; the engine never warms up. So can a new habit of 80 mph on the interstate. How driving style affects fuel consumption puts numbers on each.
- Tires. Pressure 10 psi low costs about 3%; a set of aggressive all-terrain tires on a crossover costs more. Check pressure monthly, cold.
- Maintenance. A clogged air filter, old spark plugs, a lazy oxygen sensor, a thermostat stuck open — every one shows up in the log weeks before it shows up as a warning light. The maintenance-by-mileage checklist is the list of suspects; CarMD’s 2026 report puts a failing oxygen sensor at up to 40% worse fuel economy if ignored.
- A fault. A sustained 20–25% drop with no change in the first four items is a diagnostic request. Read the codes — our guide to the ten most common check-engine codes explains what each one means for fuel — and bring the log to the shop: “the car went from 30 to 24 over six weeks starting in March” is a better opening than “it feels thirsty”.
If you drive an automatic and want the practical side of the same story, we have collected what actually reduces fuel consumption on an automatic; and for a sense of what real owners of one very common car see against its sticker, the Toyota RAV4 real-world mpg teardown and the vehicle knowledge base behind the app list the declared figures model by model.
Frequently asked questions#
How do I calculate my gas mileage?
Fill the tank to the first click and write down the odometer. Drive normally. At the next fill-up, fill to the first click again and note the gallons on the pump and the odometer. Miles driven divided by gallons added is your miles per gallon for that interval. Repeat over three or four tanks and divide the total miles by the total gallons — that running figure is your real gas mileage.
How accurate is the MPG display in my car?
Close but optimistic. In a 2021 AAA test the in-dash average was off by 2.3% on average, with the worst vehicle reading 6.4% higher than the fuel it actually burned; an Edmunds test found an average of about 5% optimistic, with hybrids and diesels up to 15–19% high. Two full tanks of arithmetic tell you exactly how much your own display flatters you.
Why is my real MPG lower than the EPA sticker?
Because the sticker is a lab result adjusted to represent an average American driver, not you. Cold starts, short trips, air conditioning, speed above 65 mph, roof racks and winter fuel all cost mileage the test cannot see. Consumer Reports found modern labels within about 3% of its own tests on average, but hybrids and small turbocharged engines miss by 9–15%. A 10–15% shortfall is normal; a 25% gap is a driving-pattern or maintenance question.
How many miles do I need before the figure is reliable?
At least three full tanks, ideally 1,000 miles or more. A single tank can be off by 4–5% just from where the pump clicked off, and one short-trip week or one highway weekend skews it further. The running average over several tanks converges on your real figure; the per-tank numbers never do.
Should I fill to the first click or top off?
First click, every time. Topping off adds an unpredictable amount of fuel, can flood the vapour-recovery canister and trip a check-engine code, and makes the next interval look thirstier and this one look thriftier. The method does not need a truly full tank — it needs the same level every time.
How do I convert L/100 km to mpg?
Divide 235.2 by the figure. 7.8 L/100 km is 235.2 ÷ 7.8 = 30.2 mpg, and the same division works backwards: 30 mpg is 235.2 ÷ 30 = 7.8 L/100 km. British mpg uses the larger imperial gallon — multiply US mpg by 1.2 to compare with a UK review. Kilometres per litre is 100 divided by the L/100 km figure.
What counts as good gas mileage?
The EPA’s fleet-wide real-world average for new vehicles is around 27 mpg, so a car doing 30 or better in mixed driving is above average, a full hybrid does 40–50, and a full-size pickup or a three-row SUV does 17–22. The more useful benchmark is your own car’s sticker: within 10% of the combined figure is a healthy car and a normal driver.
Does gas mileage really drop in winter?
Yes. Fueleconomy.gov puts the penalty for a conventional gasoline car at about 15% at 20 °F compared with 77 °F, up to 24% on short trips, and 30–34% for hybrids, whose engines run more to make heat. Winter-blend gasoline and E10 also hold slightly less energy per gallon. Compare winter to last winter, not to July.
The takeaway#
Miles between two clicks, divided by the gallons of the second one; repeat until the running figure stops moving. Ignore the trip computer for keeping score, ignore the sticker for predicting your bill, and ignore any single tank. Fill to the first click, use the odometer, mark the partial fill-ups and the missed ones, and convert units with one division when someone quotes you litres. Do that for a season and you own a number nobody can argue with — and a baseline that will tell you about a stuck thermostat before the dashboard does. Brimly keeps that log on your iPhone: a fill-up from the receipt in three seconds, the arithmetic done only between full tanks, your EPA figure behind the trend, and a nudge when the number drifts.